

The short version
- Average FPS tells you how many frames a game draws per second on average. It doesn't tell you how evenly they arrive.
- Frame time is how long each single frame takes, in milliseconds. 60fps works out to 16.7ms per frame, and 30fps to 33.3ms.
- 1% lows describe the slowest 1% of frames. A big gap between the average and the 1% low is what you feel as stutter.
- Steam began showing frame rate charts for Steam Deck games on November 9, so knowing how to read them is more useful than ever.
Frame time is the real number
FPS is just frame time turned upside down: frame time (ms) = 1000 ÷ FPS.
| Frame rate | Time per frame |
|---|---|
| 30fps | 33.3ms |
| 40fps | 25ms |
| 45fps | 22.2ms |
| 60fps | 16.7ms |
| 90fps | 11.1ms |
| 144fps | 6.9ms |
The problem with an average is that one very slow frame barely moves it. Picture a second of play at a steady 16.7ms per frame, with a single 100ms hitch in the middle. The average still reads in the mid-50s, but you'll feel that hitch as a clear stutter, because for a tenth of a second the image froze.
Same average, different feel
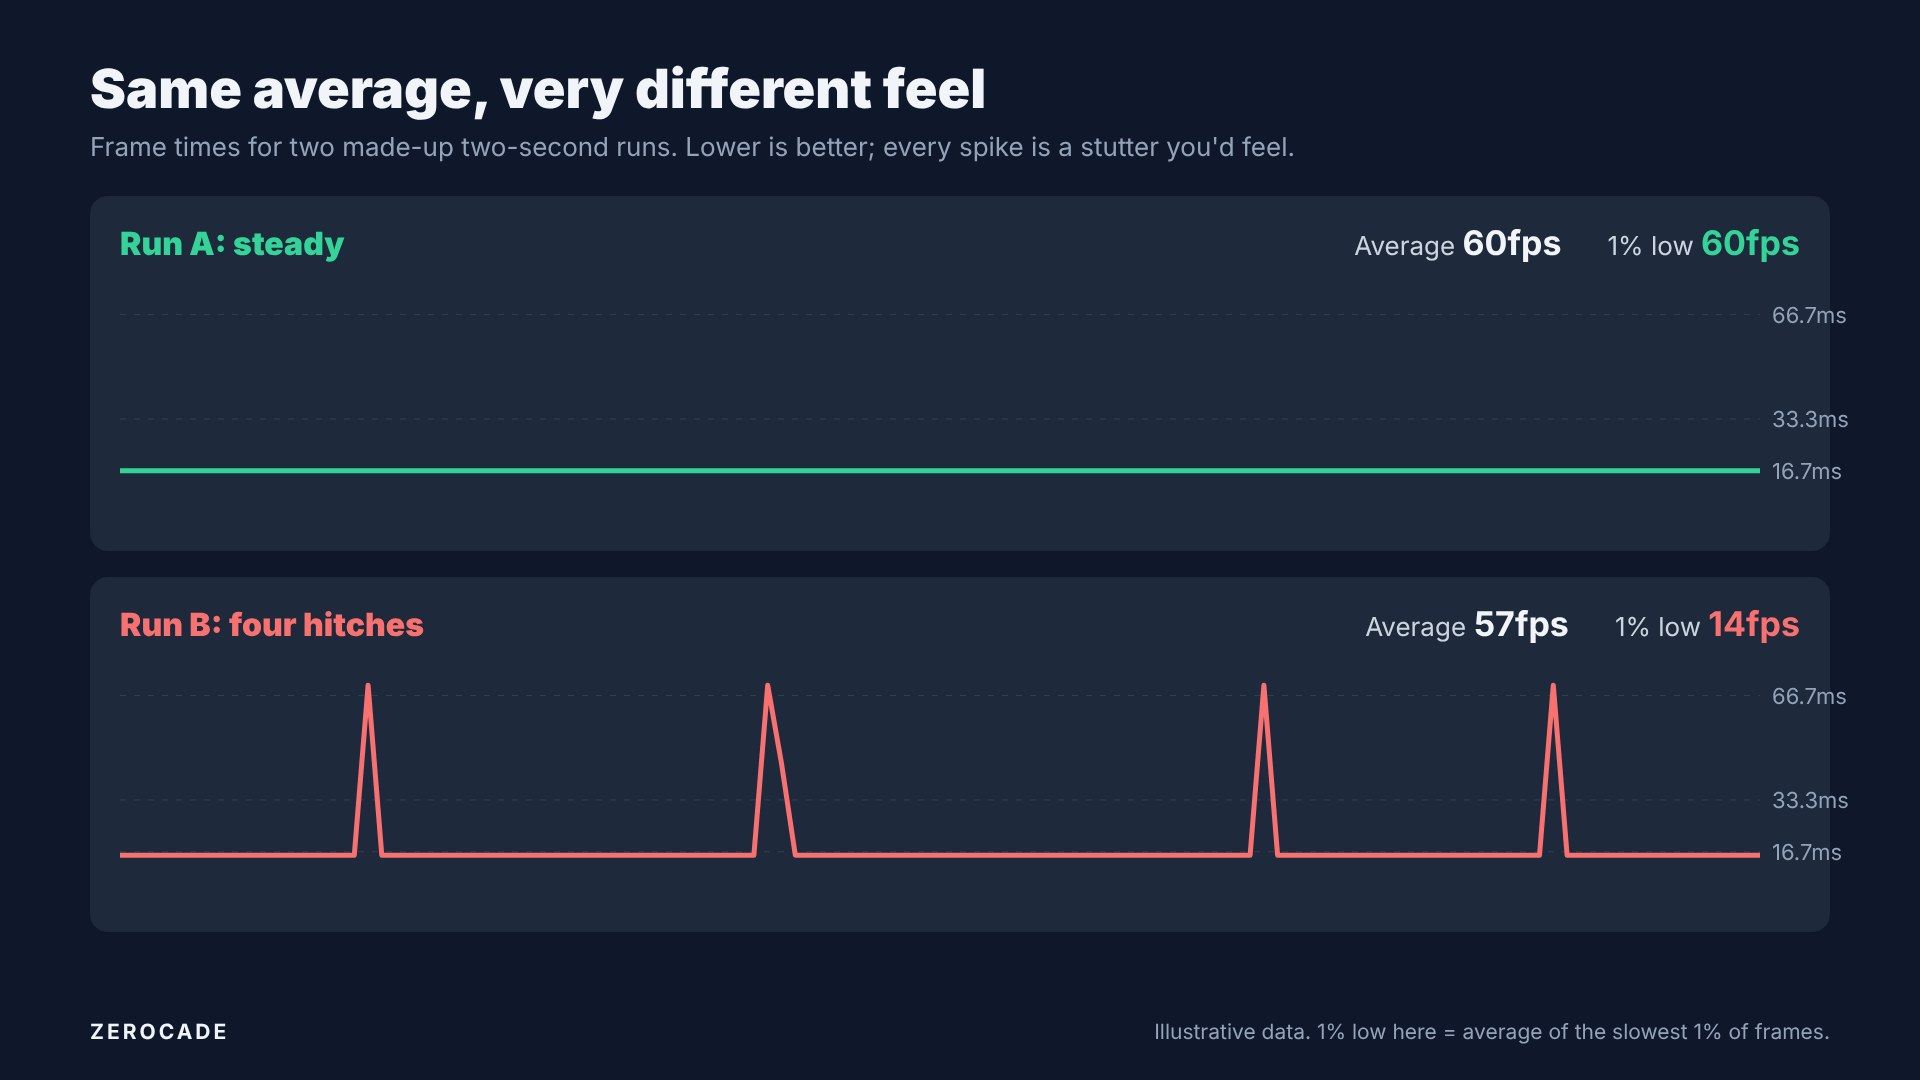
Image: Zerocade
In our made-up example, Run A is a flat 60fps. Run B averages 57fps, barely lower, but has four hitches up to 70ms. Its 1% low collapses to 14fps. On a benchmark chart that only shows averages, these two look nearly identical. In your hands, they wouldn't be.
How 1% lows are calculated
Here's the catch: different tools calculate "1% low" in different ways, so numbers from two tools aren't always comparable. Tool maker CapFrameX documents three methods.
- Percentile. Sort every frame from fastest to slowest and take the frame at the 99th percentile. With 1,000 frames, that's the 10th-slowest. Anything slower is ignored. Intel's PresentMon reports plain percentiles like this.
- Average of the slowest 1%. Take the 10 slowest of those 1,000 frames and average them. Every bad frame counts, so this always comes out lower than the percentile method. GamersNexus says it uses averages of the worst 1% and 0.1%.
- Time-based. Add up the slowest frame times until they make up 1% of the total run time, then use the frame where you stop. MSI Afterburner uses this approach, and CapFrameX offers it as an option.
On the same data, tools can differ by about half a frame per second just from rounding. 0.1% lows can rest on just two or three frames in a short test, so they jump around more between runs.
What a frame rate histogram shows
A histogram shows how much of your play time was spent at each frame rate.
- One tall, narrow peak means steady performance.
- A long tail to the left means drops and stutter.
- Two peaks usually mean VSync snapping. On the Steam Deck OLED's 90Hz screen, a game that can't hold 90fps drops straight to 45, so its chart can show peaks at 90 and 45. Valve points this out in its own announcement.
A histogram tells you how often a game runs slowly. It doesn't tell you where or why.
Real examples
- Silent Hill 2 remake (Unreal Engine 5). Digital Foundry found traversal stutter when the game loads new areas. In Wccftech's tests with an RTX 4090, the unmodded game averaged 181.7fps with a 0.1% low of 45.8fps. A fan mod raised the average just 1.6% but lifted the 0.1% low by 52%, to 69.8fps. The difference you'd feel is in the lows.
- Oblivion Remastered on Switch 2. Digital Foundry found a 30fps cap with frame times swinging between 16ms and 50ms, traversal hitches up to 230ms, and even brief drops to 0fps. The average says 30fps. The frame times show why it doesn't feel like it.
- Shader compilation stutter. Epic says compiling the shaders for a single draw can take tens of milliseconds or more, and the game stops while it waits. That's why many Unreal Engine games stutter the first time you see a new effect. Epic added shader precaching in Unreal Engine 5.2 to tackle it.
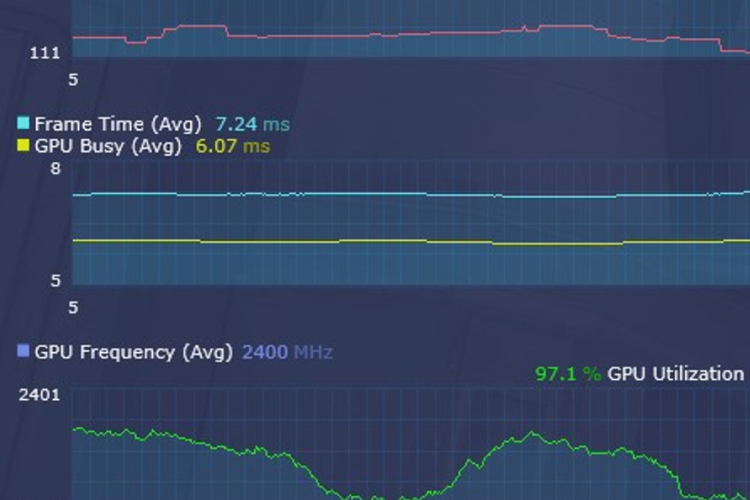
Image: Intel
Frame pacing and VRR
Frame pacing is how evenly frames arrive. 30fps made of steady 33.3ms frames looks smoother than 30fps made of a mix of 16ms and 50ms frames, even though the average is the same.
VRR (variable refresh rate: G-Sync, FreeSync and HDMI VRR) lets the screen refresh whenever a frame is ready, instead of on a fixed clock. That stops the 90-to-45 snapping and tearing, so frame rates like 50fps feel smoother. VRR can't fix a single 200ms hitch, though, and it only works within the display's supported range. The Steam Deck's own screen doesn't have VRR.
How to measure it yourself
On Steam Deck: press the … button, open the Performance tab and set Performance Overlay Level. Level 1 shows FPS only. Level 2 adds a frame time graph. Level 3 adds a bigger frame time graph with minimum, maximum and current values. Level 4 shows everything, down to per-core clocks.
On PC:
- MSI Afterburner with RivaTuner can show 1% and 0.1% lows in its overlay.
- Intel PresentMon is free, works on any GPU, and shows frame time graphs, histograms and percentiles.
- CapFrameX is free, built on PresentMon, and good for recording and comparing runs.
- Nvidia FrameView is also built on PresentMon.
- Steam's own overlay (Settings > In Game) shows frame rates and separates generated frames from real ones.
What to look for
When you read a benchmark or Steam's new charts, look at the gap between the average and the 1% low, not just the average. A small gap means a smooth game. A big gap means a game that stutters, however good the average looks.